Searching for 2020 Election Results Clues Using Voter Registrations
NOTE: For help with forming a voting plan, reading your local ballot, and other voting information, please visit https://votesaveamerica.com/. Do your part and make sure to vote!
The 2020 Presidential Election is less than two weeks away. There’s been a deluge of articles and reporting on the polls as election day nears, and the noise has been almost overwhelming. For anyone trying to stay informed, there’s been an endless number of daily articles to sort through...anyways, this is another article about the election. But rather than discuss the polls and early voting (the latter of which is not very predictive) to predict who may come out ahead in November, I’d like to discuss a different metric. One that may provide us a different insight into forecasting the results: voter registration counts. Looking at trends in voter registration by party affiliation or certain demographic and geographic variables can provide clues into which party has an edge in voter engagement - and thus, potentially, votes. Specifically, I want to look at voter registration patterns in swing states - like Florida and Pennsylvania - since these are the states whose outcomes are currently most unpredictable and whose outcomes will decide the winner. These are the states “on the margin” of the election, so voter registration edges are most important among these specific parts of the electorate. By comparing recent trends as well as comparisons to past elections, we may find hints as to who has the advantage in these battleground states.
Data on voters are, on the whole, surprisingly available. By perusing state government websites, I was able to access public excel sheets with voter registration rolls conveniently broken down by party, demographics, counties, and other interesting characteristics.
Pennsylvania
Let’s start off with the state deemed by FiveThirtyEight to be the tipping point of the election, and my current state of residence: Pennsylvania. An obvious starting point is to compare registrations by political party to see who has the edge. I added another dimension to this chart, including registration counts as of June 2nd - when the primary was held in PA. (Note that October 19 was the last day to register to vote in Pennsylvania, so those numbers are theoretically the final total for the general election). This can inform us if there may be an advantage for one party in recent voter enthusiasm. One very, very important note that I’ll repeatedly emphasize: Republican registrations don’t mean votes for Trump, just as Democrat registrations don’t necessarily mean votes for Biden. There’s a sizable portion of each group that will likely vote for the opposite party’s candidate, and it’s critical to keep in mind that registrations are by no means 1:1 with votes.

That being said, we see a clear advantage for Democrats in terms of raw voter registrations. If we assumed that party registrations are analogous to votes for the party’s candidate, then the key for Biden to win PA is to simply drive up voter turnout. If both parties get all their registrants to vote, Trump’s only hope would be to have nearly all “Other Party” registrants vote for him, an exceedingly unlikely scenario (though not impossible - in 2016, Trump captured a large portion of late-deciders and independents). But perhaps a more interesting comparison would be the most recent registration counts with the 2016 results:

First off, the October 19 data is voter registrations while the 2016 data is actual voters, likely a big reason for the overall lower counts in 2016 - only about 70% of registered voters actually cast a ballot. So again we see a major advantage for Democrats in terms of potential voters. But the key is which party can drive higher turnout (as well as other factors this year such as rejection rates for mail-in vs. in-person ballots, which we won’t be getting in to here).
Another interesting dimension to voter registrations is the breakdown by ages. Comparing within parties the age shares, we see the well-known story of younger votes leaning left and senior citizens leaning right. Younger voters historically have had much lower turnout rates than older voters, to the dismay of liberal candidates like Bernie Sanders that draw huge support from the Gen X and Millenial crowd but lackluster results on election days.

So this could be another area of concern for Biden if he needs to rely on driving up youth turnout. In 2016, Trump’s margins with older voters are what helped carry him to ultimate victory. A larger base is only useful if the base actually shows up to cast votes. Looking at the absolute count (instead of relative as with percents), however, reveals Biden’s strength in 2020.

Though the Democrats certainly lean more on younger voters, in terms of registrations they carry the advantage in every single age bracket except for 55 to 64. Media outlets have noted that Biden’s huge margin over Trump in current polls is largely driven by his margins with older voters, and in PA we see hints of this with registrations. And no state is more associated with senior citizens than…
Florida
The good news with Florida voter data: the state website provides monthly counts by party affiliation! The bad news with Florida voter data: they stopped updating the data at the end of August, so we’re lacking September or October numbers. But when you’re working with public data, you take what you can get.

Comparing registrations over time, we actually see that Republicans began closing the gap in recent months - a trend seemingly confirmed by news outlets. They’re coming from a ways behind, however, as Democrats carried a substantial lead in registrations, likely helped by the competitive primary in the beginning of the year. You can also see total new registrations basically flatline for both Republicans and Democrats in April. Another effect of the pandemic was an inability for in-person voter registration drives, dampening new voter gains until just recently. Whether this will have a significant effect on final registrations compared to previous elections is hard to determine, especially with the increased voting information campaigns held online in the past several months. It seems that expanded voting with mail-in ballots and heightened voter awareness may actually result in record-breaking turnout.
North Carolina
While I was hoping to also cover one of the Upper Midwest states (Wisconsin, Michigan, etc.) that seem particularly crucial for Trump to secure if he wants to be re-elected, I was unable to find data broken down by party affiliation for those states. So instead, let’s take a look at North Carolina - another state that seems close to tied in the polls, and if won by Biden would be a likely sign of his victory on Election Day.
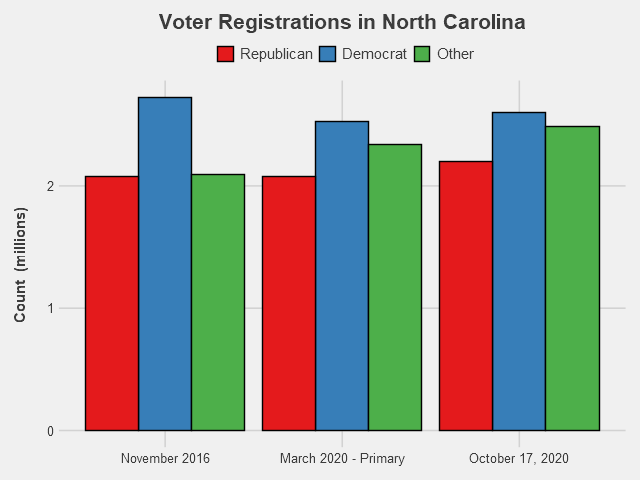
North Carolina has a much higher share of not-affiliated/minor party voters than the previous states we looked at. In fact, there’s more “Other” voters than Republican-registered voters, and almost equal numbers of Other and Democrat. That makes it even harder to determine which candidate has the advantage by registrations. How these voters lean will likely determine the outcome for the state. In other ways, however, NC resembles the trends in other swing states. Democrats overall have the registration edge, having especially gained ground on Republicans thanks to their competitive primary, while recent months have seen Republican registrations closing that gap. The fact that Democrats had such a huge registration lead in 2016, but the state ended up going to Trump, is another reminder that registrations do not mean votes. Certainly in a state with so many Other voters, winning the registration battle is only one component needed for electoral success.
Conclusions
So far, we’re seeing huge margins for Democrats in the early voting. Let the above charts serve as a warning not to make conclusions from those numbers - while Democrats do have leads in many swing states, they are not as advantageous as the early voting data may suggest. It is likely that due to partisan rhetoric, Republicans will at least tighten the current margins on Election Day. And even with voter registration data, we don’t actually know if those registered voters are supporting their party’s candidate, or if they’ll actually even vote. In a world where party affiliation equates to a vote for that candidate, we could say with some confidence that Biden would win. Since we aren’t in that world, the next best thing is to keep an eye on as much data as we can - voter registration counts, early votes results, and especially the polls.
Final Notes
Voter registration data was collected from the following sources:
Charts seen in this post were made in R using the ggplot2, tidyverse, readxl, RColorBrewer, and Cairo packages.
If you have questions or constructive feedback, feel free to email me at troded24@gmail.com, submit an inquiry on this website, or leave a comment on this post! Thanks for reading, and please - make sure to vote this election.